

Monitor Panel
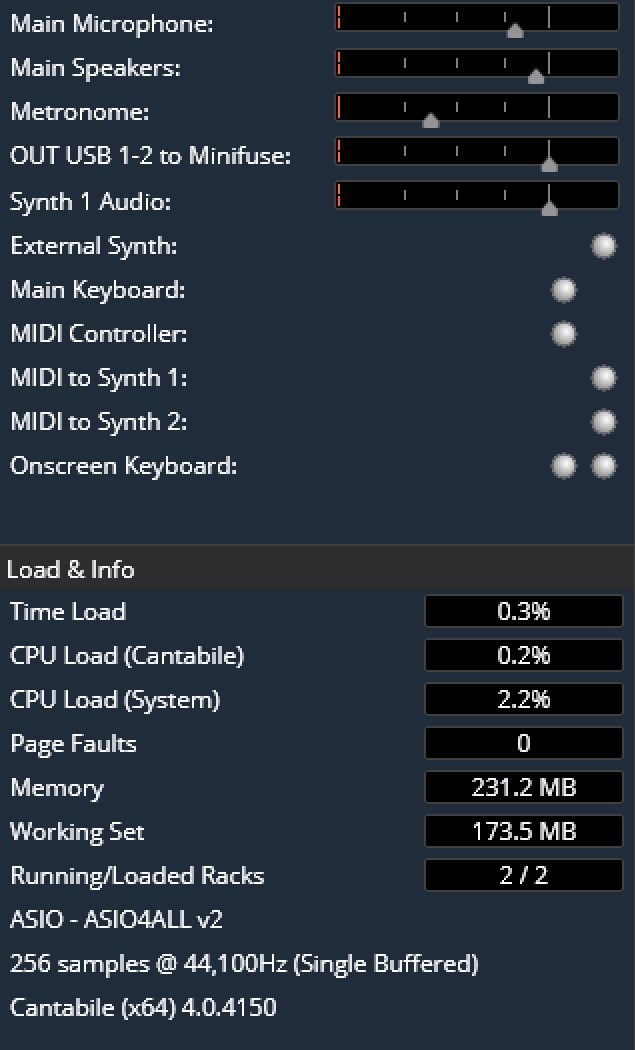
The monitor panel displays audio level and MIDI activity indicators for all of the currently active environment ports. It also displays important performance metrics of the audio engine.
To show the monitor panel, select "View" menu → "Side Panel" → "Monitor", or click the monitor tab on the side panel.
Ports Display
The list of displayed ports automatically updates to include all ports enabled in Options → Audio Ports and Options → MIDI ports.
Unlike other audio level meters which are limited in how many channels they can display, the level meters in the monitor panel expand to show all channels.
These audio level meters also incorporate a gain level slider - click on the level meter to adjust gain levels on audio ports.
Load and Info Display
The bottom half of the monitor panel displays the following performance metrics:
- Time Load - maximum processing load as a percentage of the audio cycle time over the previous 1 second (this is the most important metric and indicates how close to audio dropouts and glitches the current load is)
- CPU Load (Cantabile) - CPU Load caused by Cantabile and all loaded plugins
- CPU Load (Sytem) - The system-wide CPU load
- Page Faults - the number of hard page faults in the previous 1 second
- Memory - total reserved memory used by the process
- Working Set - total amount of memory actually committed to physical RAM
- Running/Loaded Racks - the number of currently running racks and the total number of loaded racks (may differ when Set List Pre-loading is in use)
- Audio driver type and name
- Audio driver buffer size and sampler rate
- Cantabile version and build number