
Using Microsoft's ProcDump and Debug Diagnostics Tools
Sometimes (rarely) Cantabile or a plugin will crash in a way that the built-in crash reporter can't handle. In these cases you can use either the Microsoft ProcDump tool or the Microsoft Debug Diagnostics tool to capture a crash report that we can use to diagnose the problem.
- ProcDump Tool - easier to use if you're comfortable working command line tools
- DebugDiag Tool - more complete crash dump reporting and easier to use if you prefer GUI tools.
ProcDump Tool
The ProcDump Tool is a command line tool for capturing crash reports.
-
Download the ProcDump tool from Microsoft
-
Extract the downloaded zip file to a working directory
-
Start a command prompt as adminstriator
-
Create a directory to store the captured crash dumps
mkdir C:\Dumps
-
Enter the following command to install ProcDump to capture crash reports
procdump -mm -i C:\Dumps
-
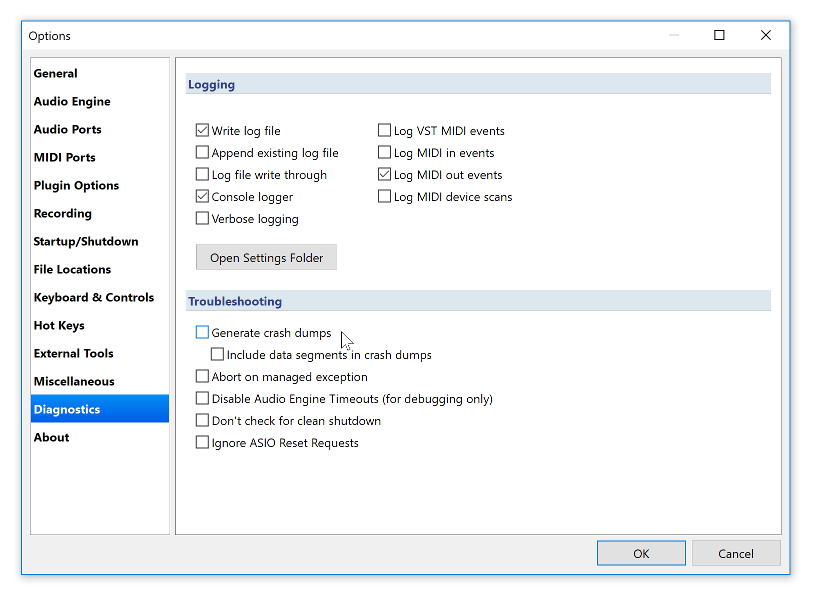
Start Cantabile and in Options -> Diagnostics turn off Generate Crash Reports and restart Cantabile
-
Reproduce the problem, or continue to use Cantabile as per normal until the crash happens.
-
When the crash occurs, zip the .dmp file from the C:\Dumps directory along with the Cantabile log file and settings file.
-
Email the files along with a note explaining the problem. If the files are large you can upload them here.
Once installed, ProcDump will capture crash reports for any program that crashes (including Cantabile). You'll see a command prompt window temporarily appear as it captures the crash report and the file will be saved to the C:\Dumps directory.
The -mm command line option above creates crash mini-dumps. To instead capture a full crash dumps replace the -mm with -ma.
To stop ProcDump capturing crash reports run the following command from an Adminstrator command prompt:
procdump -u
After disabling procdump, don't forget to re-enable crash dumps in Cantabile's diagnostic options.
DebugDiag Tool
The follow steps describe how to use this DebugDiag.
-
Download the Debug Diagnostics tool from Microsoft. Note that there are two versions available - one for x86 and one for x64. Be sure to download the one that matches the platform you're running.
-
Install the Debug Diagnostics tool, accepting the default installation options.
-
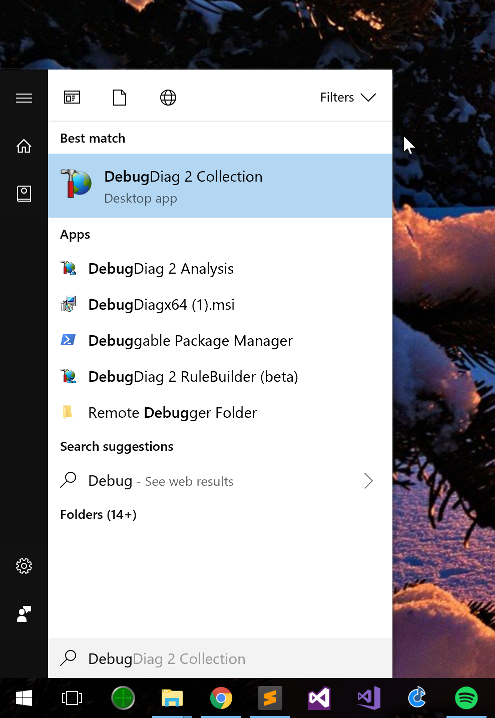
Run the DebugDiag 2 Collection program which can now be found in your start menu. (Hint: press the Windows start menu button and type "Debug" to find it quickly)
-
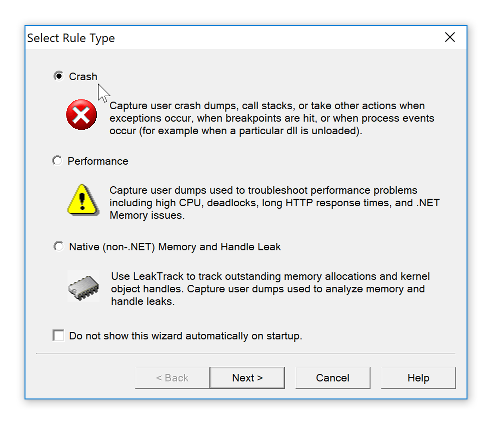
Follow the DebugDiag wizard as follows. Set the Rule Type to Crash, and click next
-
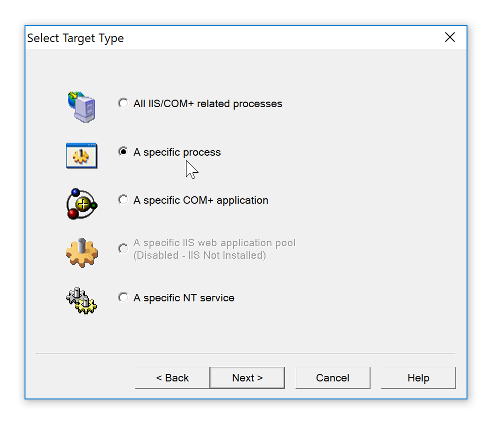
Set the Target Type as "A specific process":
-
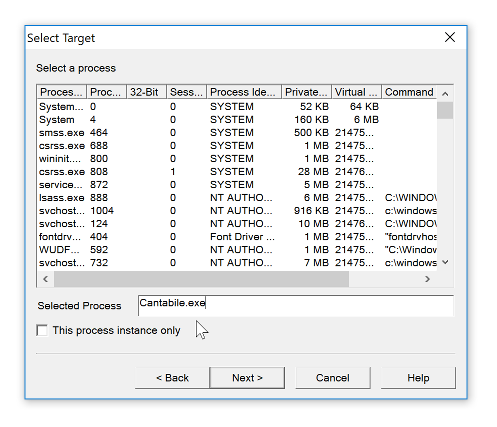
On the next screen, ignore the list of processes and simply type "Cantabile.exe" (without the quotes) into the Selected Process field and leave "This process instance only" turned off, as shown below:
-
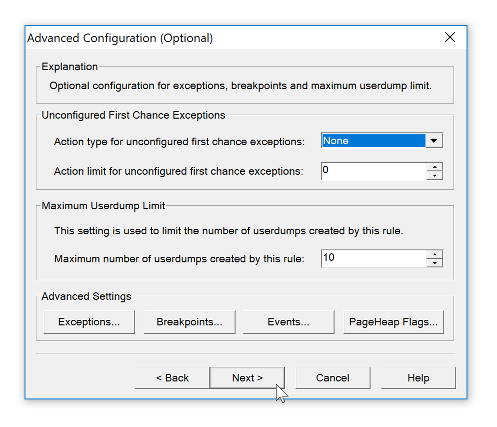
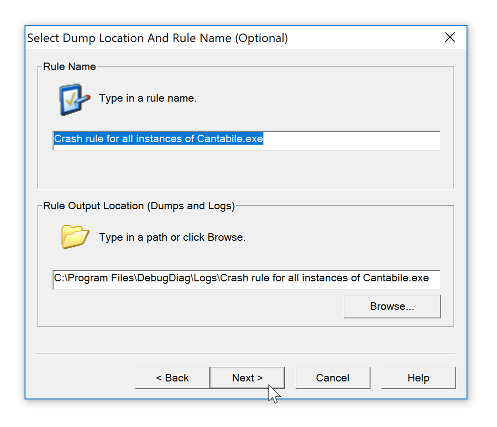
The rest of the wizard steps you can simply click Next:
-
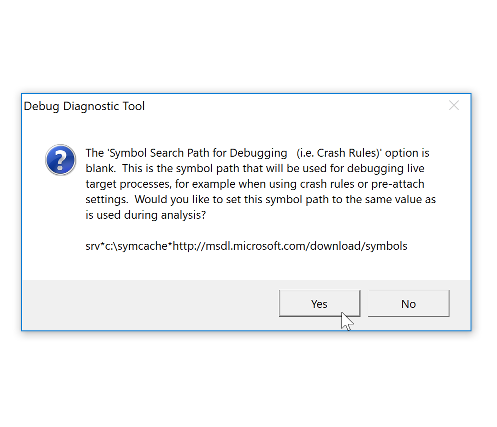
You may be prompted about a "Symbol Search Path for Debugging". If so, click Yes.
-
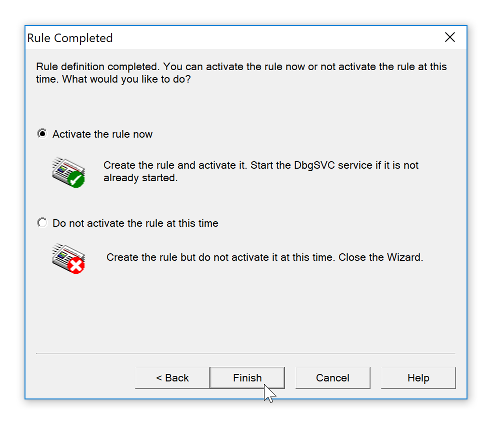
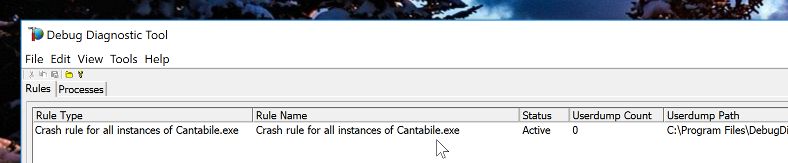
By the time you're finished it should look like this:
-
The DebugDiag tool it now configured to capture any unhandled exceptions in Cantabile. If you can start Cantabile you should now disable Cantabile's built-in crash reporting by going to Options -> Diagnostics and turning off "Generate Crash dumps". If you can't start Cantabile, ignore this step.
-
Reproduce the crash in Cantabile if you can. If the crash is random or occassional you can close the DebugDiag tool (the debug service will continue to run in the background) and continue using Cantabile until the problem occurs.
-
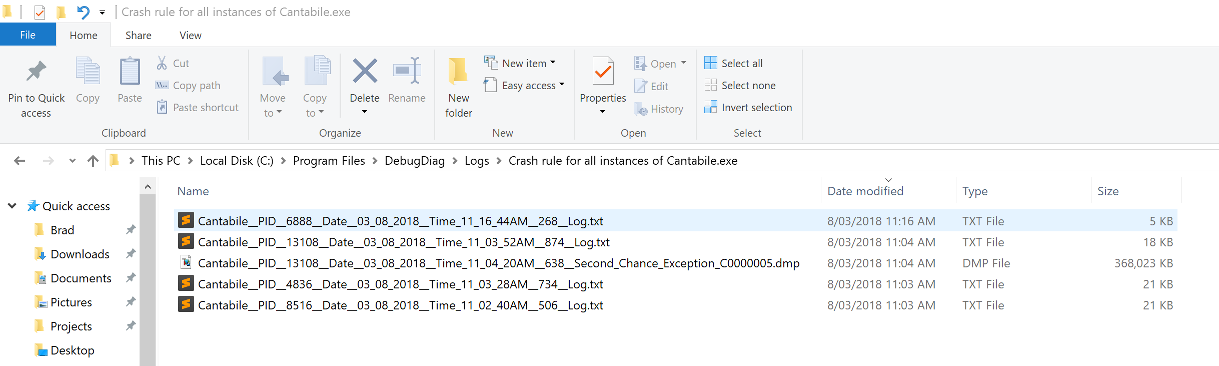
Once the problem has occurred, start File Explorer (press Windows+E) and navigate to the following folder:
C:\Program Files\DebugDiag\Logs\Crash rule for all instances of Cantabile.exeor if you're running on x86 platform:
C:\Program Files (x86)\DebugDiag\Logs\Crash rule for all instances of Cantabile.exe(you can check which path to use by starting DebugDiag tool again and looking in the last column)
-
In that folder you should find the files similar to the following:
-
The files here will typically be too large to email. Instead zip them up and upload them here and drop us an email describing the problem.
Once you've captured the crash report:
-
Disable the DebugDiag tools by starting it as shown in step 3 above.
-
Right click on the rule and choose "Deactivate Rule".
-
Go back into Cantabile -> Options -> Diagnostics and turn on "Generate Crash Dumps" to re-enable Cantabile's built-in crash reporting.